UML class diagrams in Confluence using Graphviz and DOT

One of the benefits of using Confluence for our intranet wiki is the popularity of its plug-in architecture. One plug-in that has turned out to be unexpectedly useful is the Graphviz plug-in, which provides a quick and easy way to draw UML class diagrams without getting sucked into endlessly tweaking the diagram. This article shows you how.
This is actually very important for agile software development, when you keeping to a useful minimum amount of documentation lets you put more energy into producing working code. As I explained in an earlier article on using a wiki for project documentation, keeping design documentation in a collaborative on-line environment like a wiki makes it far more useful than it would be on paper, which is why print-oriented tools are not appropriate. The same applies to the diagrams; vector drawing programs are overkill for design diagrams, where the ease of making changes and publishing the results is more important than fine control over high-resolution output.
The Flowchart Macro
Atlassian Confluence comes with a Flowchart Macro, which uses Graphviz to generate diagrams from a code representation in the DOT language. The DOT reference is sparse and lacks examples, so you are better off with the other Graphviz documentation, which includes a DOT tutorial in PDF format, and a new Node, Edge and Graph Attributes schema reference.
Here is a simple example to start with.
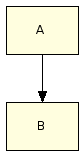
{flowchart}
A -> B
{flowchart}
Technically this a directed graph, with nodes A and B, and on directed edge. The simplicity of the DOT language, if you are a programmer at least, means that drawing diagrams with DOT has the same feel as composing rich text documents using wiki syntax. Crucially, Graphviz does the graph layout automatically, which leaves you free to focus on the content.
This syntax defines a single edge from A to B. The two nodes do not have to be declared previously.
Basic UML
UML diagrams need different arrows to the flowchart macro’s defaults. First, we simply remove the arrows.
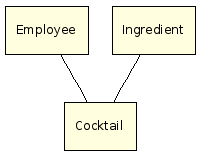
{flowchart}
edge [arrowhead="none"];
Employee -> Cocktail
Ingredient -> Cocktail
{flowchart}
This syntax uses the edge keyword to set default attributes for all edges, where arrowhead is one of the many Graph Attributes.
This may already be everything that you need to know how to draw; although you can add far more detail about classes and relationships to a UML class diagram, you get most of the value just by putting class names in boxes and indicating which classes have some relationship. After all, the details of attribute types and cardinalities are perfectly well represented by the code itself.
By default, the DOT layout algorithm arranges nodes from top to bottom, with edges directed downwards, avoiding crossing edges. Sometimes you can improve the layout by specifying which nodes should be arranged horizontally.
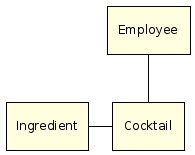
{flowchart}
edge [arrowhead="none"];
Employee -> Cocktail
subgraph {
  rank=same;
  Ingredient -> Cocktail
}
{flowchart}
Multiplicity
Use arrow labels to indicate multiplicity:
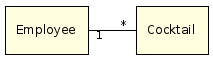
{flowchart}
edge [arrowhead="none", fontname=Verdana, fontsize=8];
subgraph {
  rank=same;
  Employee -> Cocktail  [taillabel="1", headlabel="*"]
}

{flowchart}
Relationship types
Use arrow types to indicate relationship types - composition (menu made up of cocktails), aggregation (employee drinks various cocktails), dependency (employees are defined by role) and generalisation (Caipirinha is a kind of cocktail):
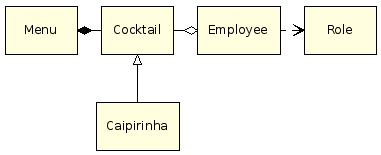
{flowchart}
edge [arrowhead="none", fontname=Verdana, fontsize=8];
subgraph {
  rank=same;
  Menu -> Cocktail [arrowtail="diamond"]
  Cocktail -> Employee [arrowhead="odiamond"]
  Employee -> Role [arrowhead="vee", style="dashed"]
}
Cocktail -> Caipirinha [arrowtail="o"]
{flowchart}
This example uses more of the Graphviz Arrow Shapes, for the head or tail of each edge. Also, the dotted dependency line uses the edge’s style attribute.
Class attributes
Use 'record' shape types to make complex nodes:
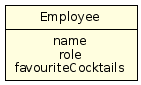
{flowchart}
  node [shape=record];
  Employee [label="{Employee|name\nrole\nfavouriteCocktails}"]
{flowchart}
This is not a complete tutorial, since UML syntax is like an onion (there is always another layer). However, this should be enough to get you started.