Linking metrics and traces with Exemplars

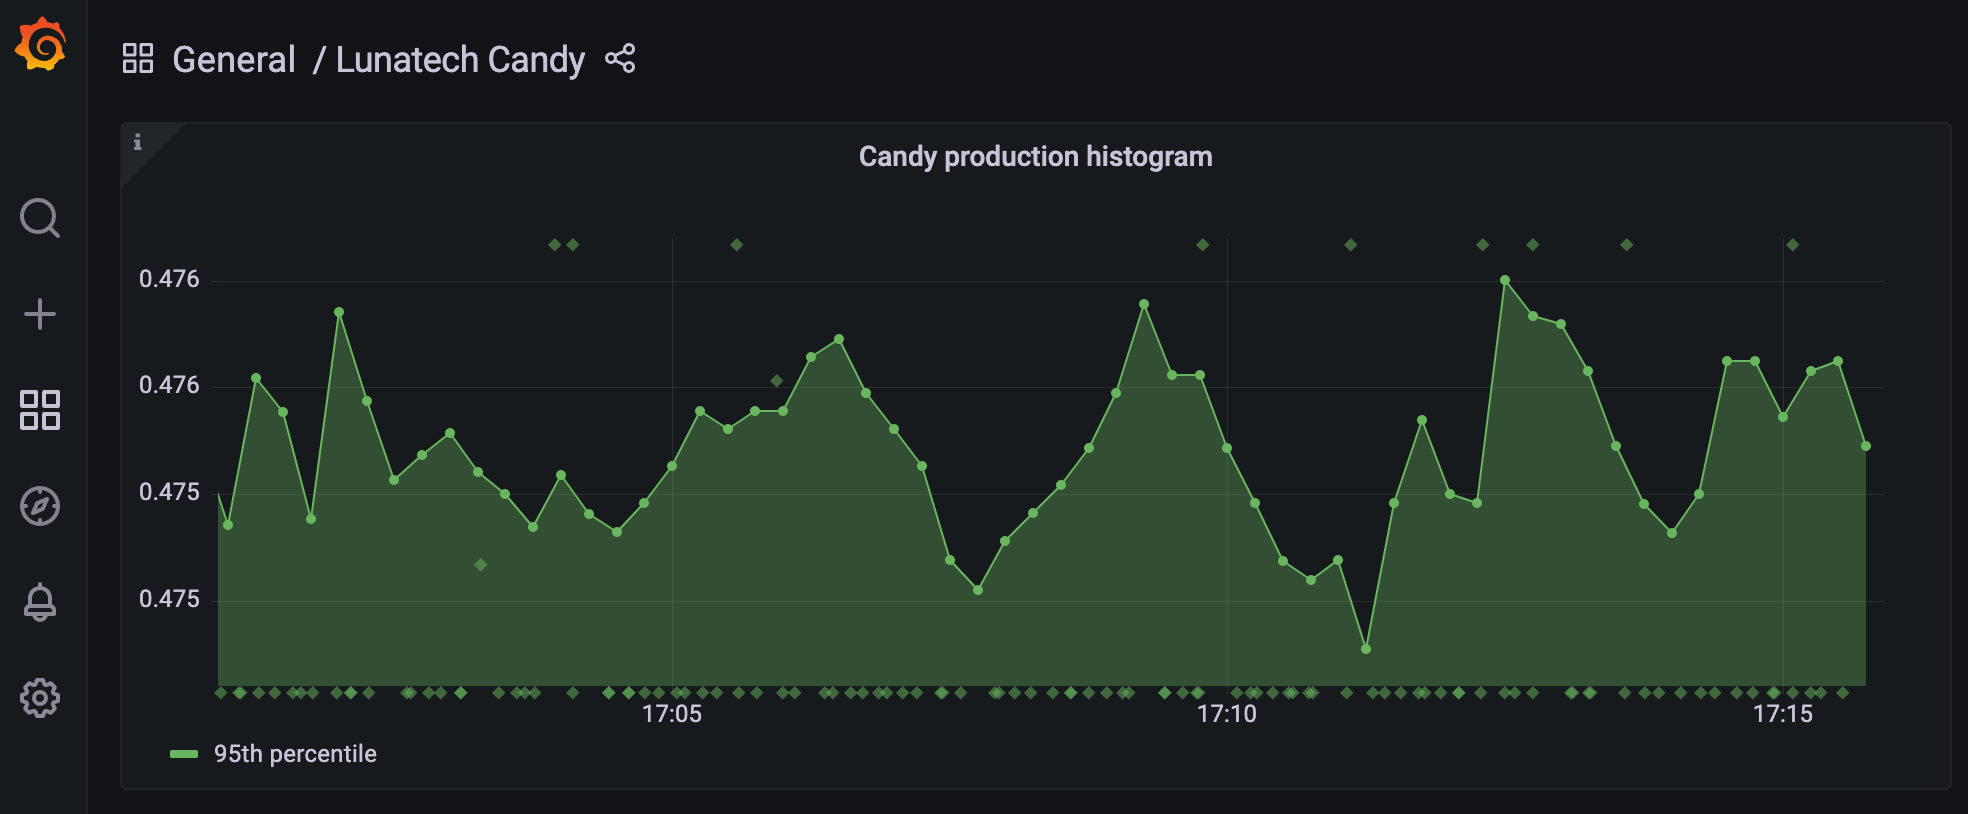
What if you could easily link a metric with a trace? And what if I told you that you can do it visually? Meet Exemplars. They are displayed as diamonds in the graph shown below.
By the end of this blog post you will be able to set up a complete docker-compose with Grafana, Tempo, Prometheus and a simple application that produces metrics and traces and links them with exemplars.
What are Exemplars
But what are exemplars, exactly? Exemplars are a concept from OpenMetrics, implemented by Prometheus.
Exemplars are references to data outside of the MetricSet. A common use case are IDs of program traces.
Grafana graphs support Prometheus exemplars. They are displayed as diamonds in the graph visualization. A mouse hovering over the diamond triggers a popup showing details about the trace along with a Query with tempo button which, when clicked, takes you to the corresponding trace visualization in Grafana Tempo.
How to setup Exemplar’s visualisation
Producing metrics and traces
The example is a candy factory run by a couple of Akka Typed Actors.
It produces candy every few milliseconds by receiving a MakeCandy message, together with a metric and a trace that shows how long the production of candy takes.
If you are not familiar with Akka Actors, don’t worry, as it is not the focus of this post.
All the source code shown in this post can be found at lunatech-traces-metrics-exemplars repository.
Behaviors.receive { (context, message) =>
  message match {
    case MakeCandy =>
      val span: Span = CandyMetrics.createSpan(tracer, "Making candy")
      val metric = CandyMetrics.ProductionCandyDurationHistogram.startTimer()

      makeCandy(context)

      span.end
      metric.observeDurationWithExemplar("TraceID", span.getSpanContext.getTraceId)
      Behaviors.same
  }
}
The metric and the trace are linked with the observeDurationWithExemplar method.
Besides the id of the trace the tag TraceID is necessary. This TraceID tag will appear later in our configuration.
For the metric we are using Prometheus metrics. We need to register the metrics beforehand:
  final val ProductionCandyDurationHistogram: Histogram =
    Histogram
      .build()
      .namespace("lunatech")
      .subsystem("factory")
      .name("production_candy_duration")
      .help("Amount of time it takes to make one candy")
      .withExemplars()
      .register()
Prometheus supports exemplars for histograms and counter metrics.
For the tracing we are using OpenTelemetry. Here is the code to start a single span.
tracer
  .spanBuilder(operationName)
  .setParent(Context.current())
  .startSpan()
In this example the trace will contain a single span, just for demonstration purposes.
Setup a docker-compose
In order to create the Exemplars visualization a few components are needed:
-
Prometheus
-
OpenTelemetry Collector
-
Grafana
-
Grafana Tempo
The complete setup can be found in the docker folder. I will only point out a few important details needed to bring Examplars together.
Prometheus
The following command has to be passed in the docker setup:
--enable-feature=exemplar-storageGrafana
Note the use of the TraceID tag in the setup of the datasource from Prometheus (also used in the source code):
 exemplarTraceIdDestinations:
   - name: TraceID
     datasourceUid: tempo
Link docker instances with the candy factory
Now that we have set up Prometheus in port 13798, we can start an HTTPServer that exports metrics.
val prometheusPort = 13798
  new HTTPServer(prometheusPort)
  DefaultExports.initialize()
And finally, we need to also send the traces to the otel-collector:
 val collectorEndpoint = "http://otel-collector:4317"
  val tracer: Tracer = Tracing.getTracer(collectorEndpoint)
We are still missing the code to instantiate the Tracer. For the sake of reducing the amount of code dumping that a look at the object Tracing here.
Grafana dashboard
In order to run docker-compose don’t forget to first create the lunatech-traces-metrics-exemplars image with:
$ sbt dockerNow we are ready to launch docker-compose:
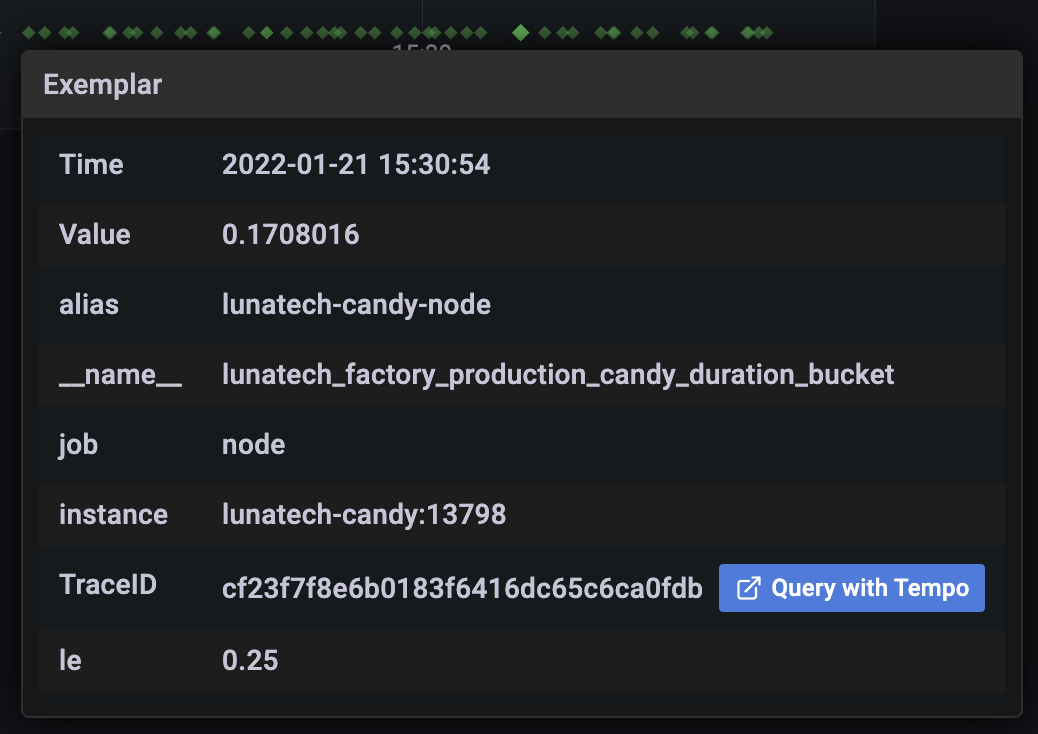
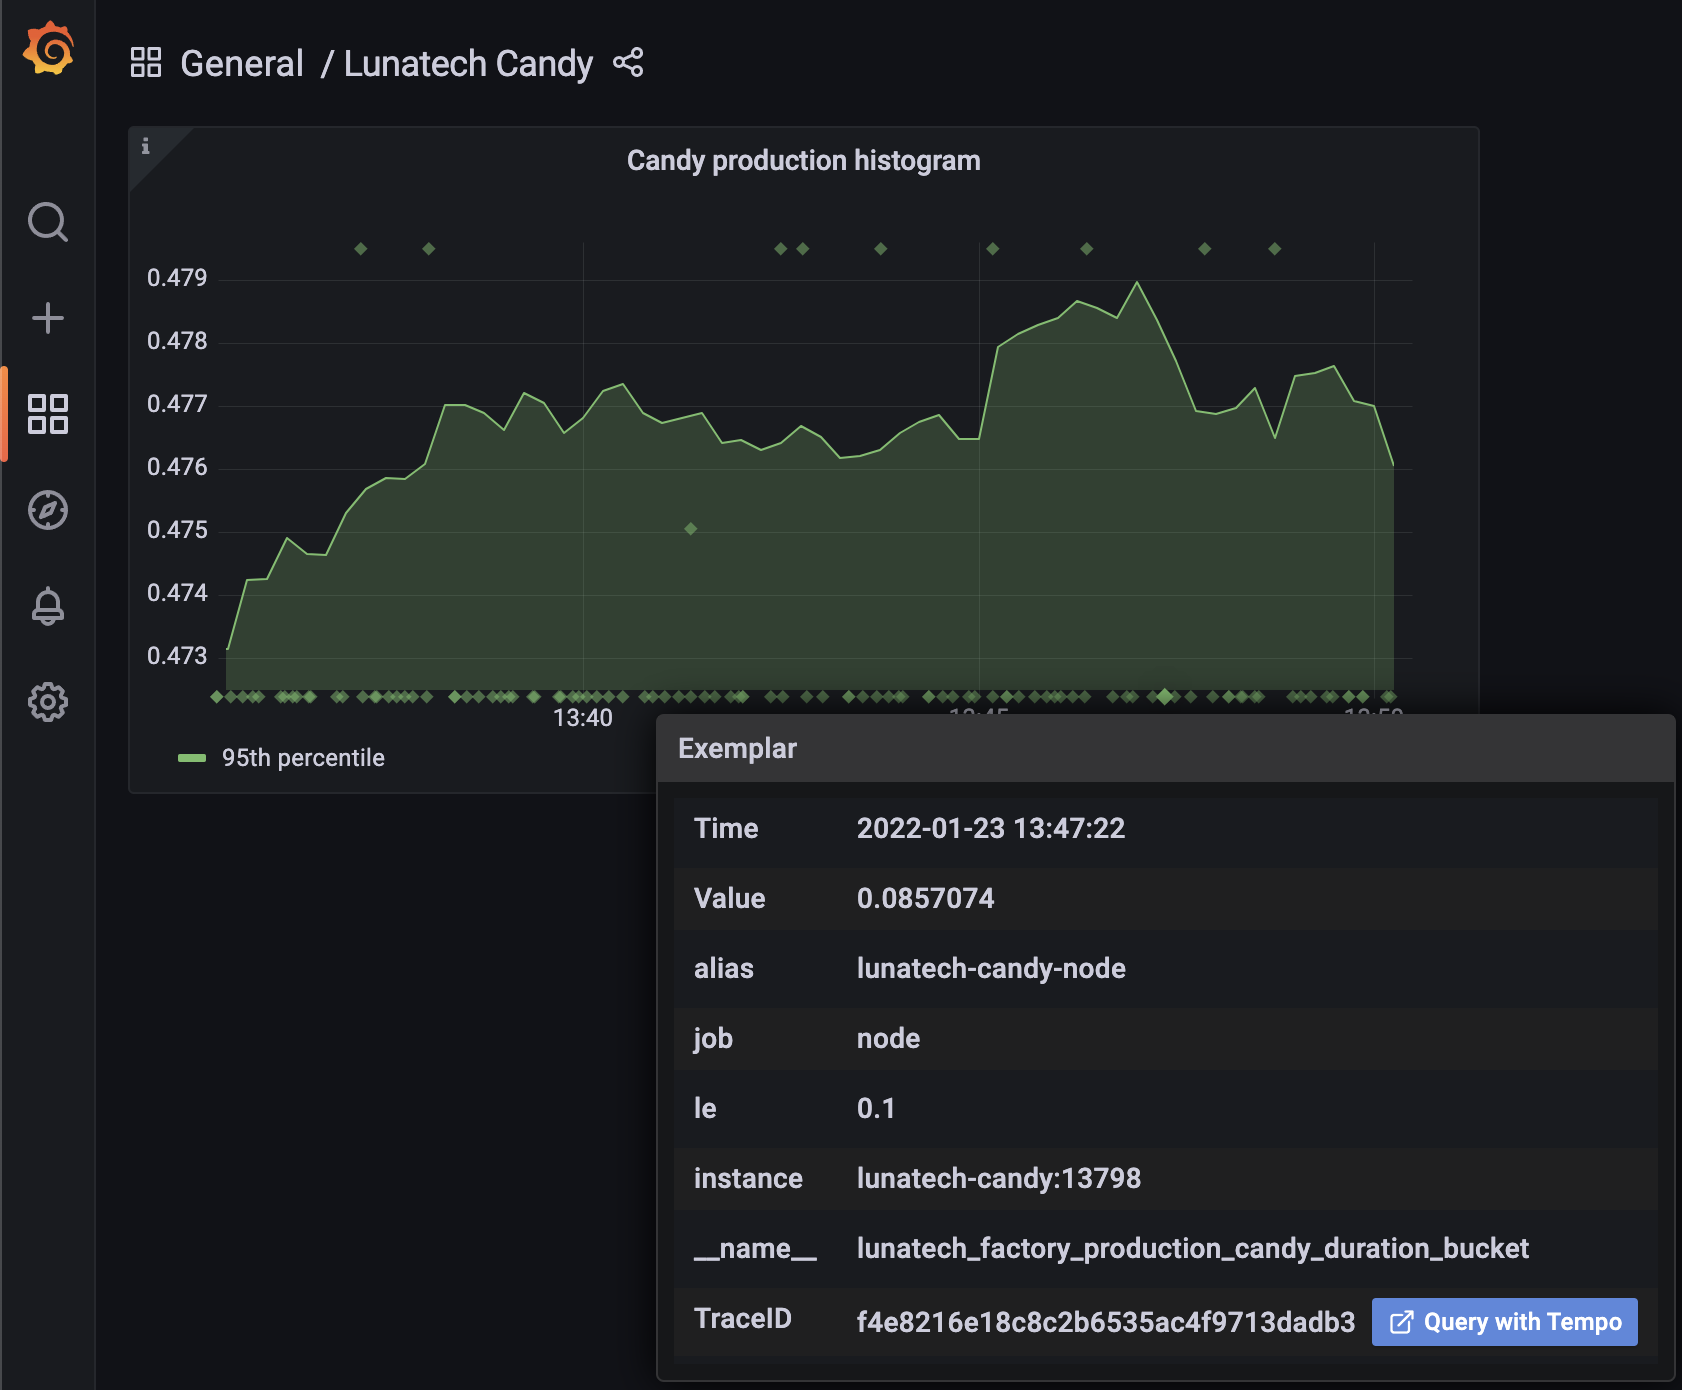
$ docker-compose -f docker/docker-compose.yml upIn the browser Grafana will be available at localhost:3000. There’s a dashboard already available. If you hover over the little diamonds you will see the exemplar’s data details:
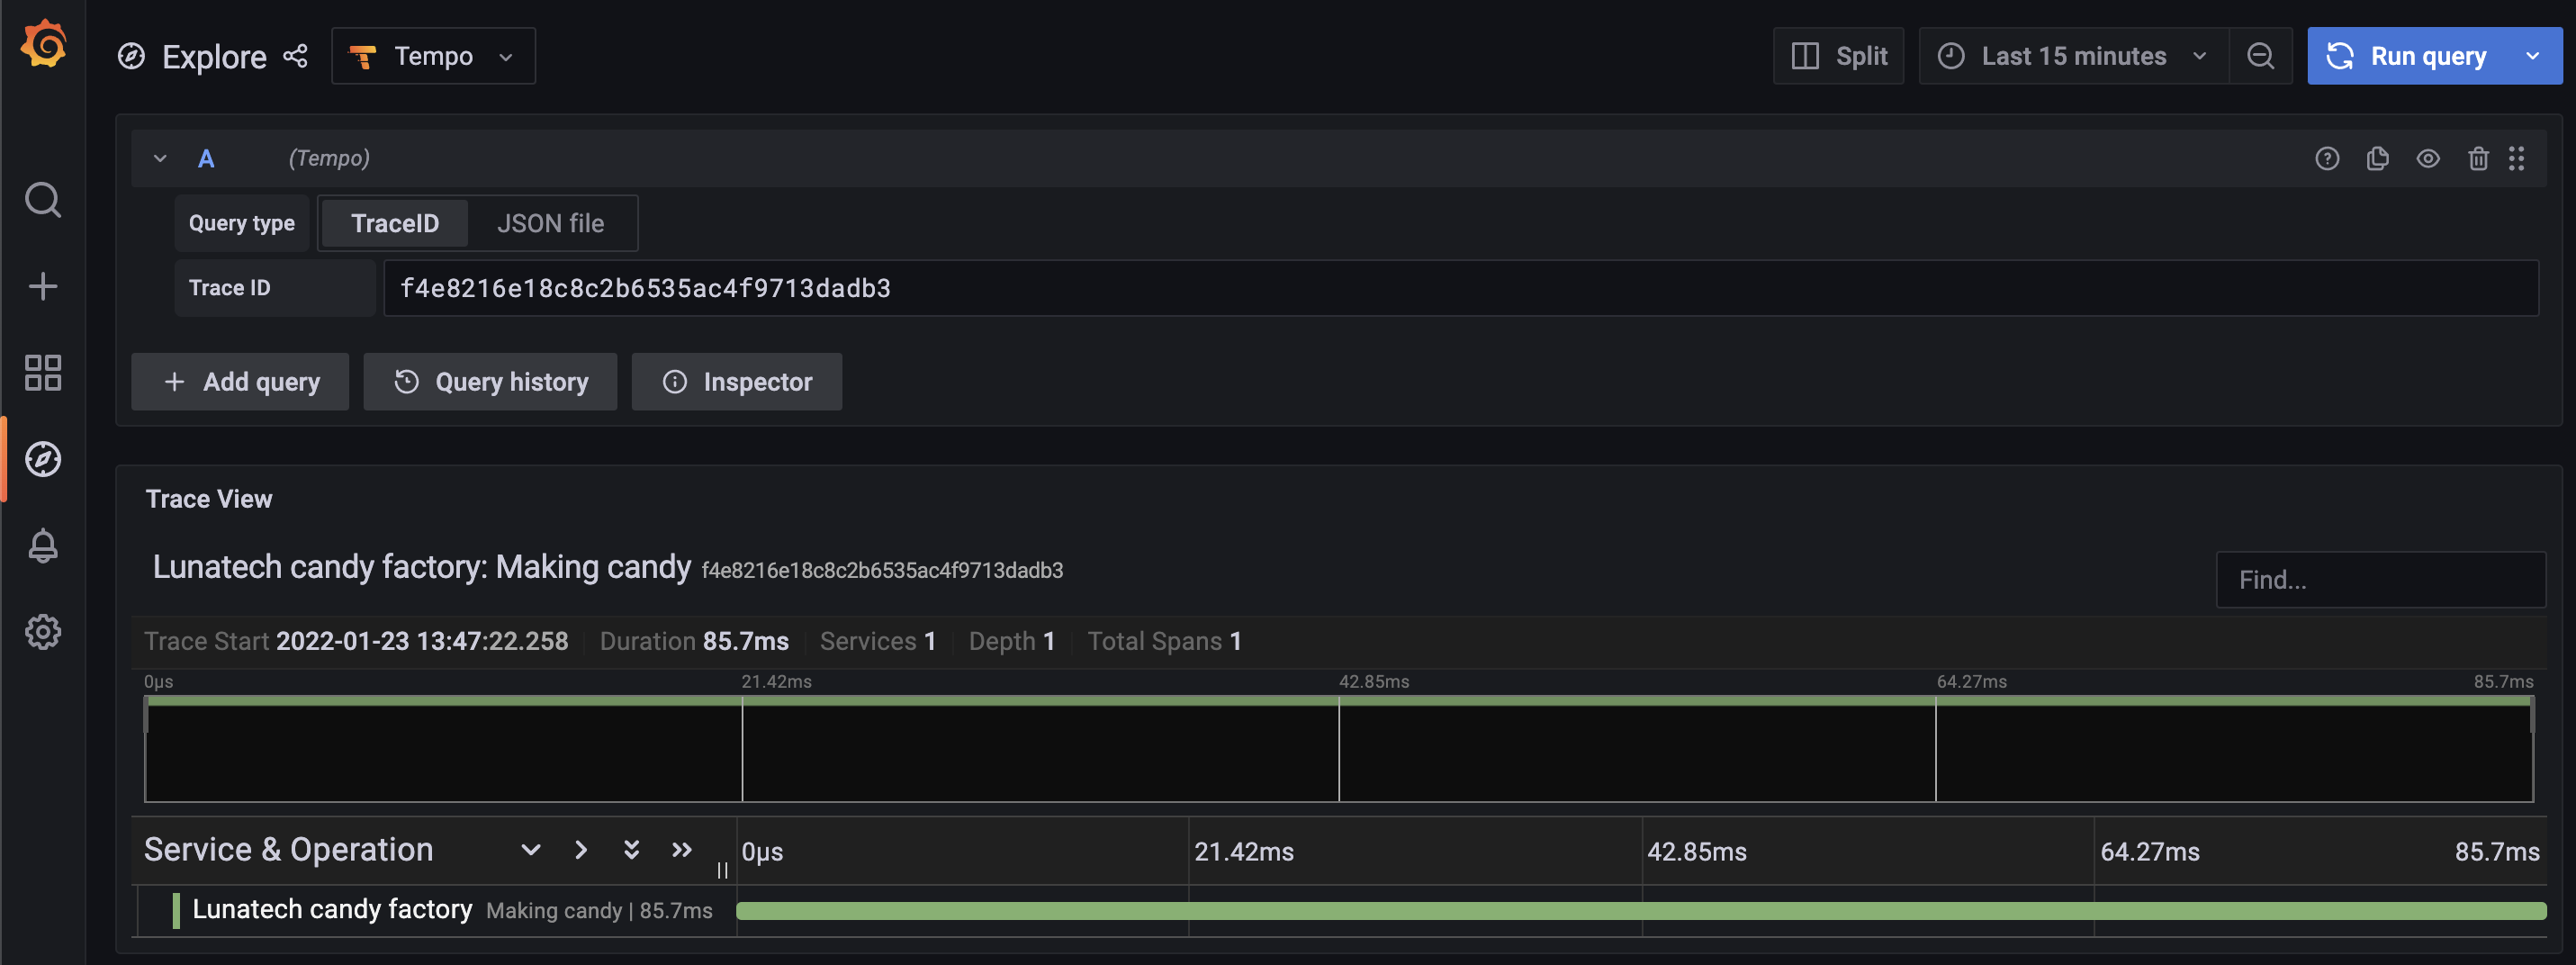
Clicking on Query with tempo will take you to the corresponding trace in Tempo:
Summary
In this post I have walked you through the steps needed to produce and visualize metrics and traces linked by Exemplars, in a docker-compose setup. I hope this post has helped you to increase the observability of your systems.